The focal point of corporate tax reform was the lowering of the corporate tax rate, which was permanently reduced from 35% to 21%. However, there are also several nuanced changes that some P/C insurers and investment professionals may have overlooked.
Tax Cuts and Jobs Act of 2017: Focal points
There are five principal elements of the act:
- Reduction in the federal corporate income tax rate to 21%
- Repeal of the Alternative Minimum Tax (AMT)
- P/C ONLY: Net operating loss carry forwards remain unchanged
- Proration percentage increased from 15% to 25%
- Dividends received deduction decreased from 70% to 50%.
These changes were particularly meaningful for tax-exempt municipal bonds, an asset class that has long been a staple of P/C insurers’ portfolios. These securities offered attractive after-tax yields, diversified risk profiles, and lower historical default rates than comparably rated U.S. corporate bonds. Tax-exempt municipal bonds also have been a favorite in the full insurance space: recent reserve take- downs have allowed some companies to increase their allocation to municipals and, thereby, enhance their bottom line.
Prior to tax reform, one of the most significant drivers of a P/C company’s portfolio allocation to municipals was the overall profitability of the enterprise. Profitable companies were able to utilize tax-exempt municipal bonds in order to reduce their tax expense. However, there was a catch in the form of AMT, which imposed a ceiling on the amount of money that could be allocated to tax-exempt municipals. This stipulation necessitated detailed modeling work to determine how many tax-exempt municipals could be used before approaching the AMT threshold.
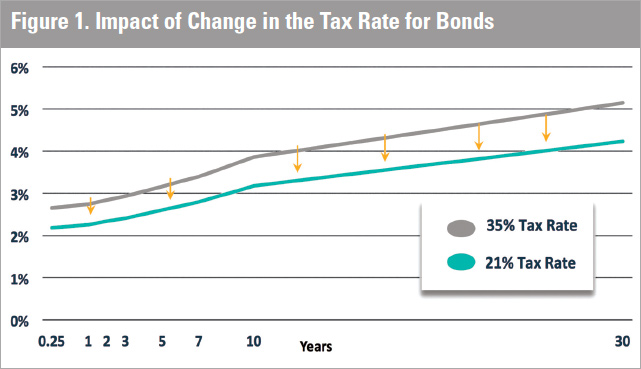
The nomenclature “tax-exempt” in the P/C world is a bit misleading. In accordance with the 1986 Tax Reform Act, 15% of P/C insurers’ tax-exempt income is taxed at the regular taxable income rate. As part of the Tax Cuts and Jobs Act, that proration percentage was increased to 25%, essentially keeping the effective tax rate on tax-exempt income the same while overall corporate tax rates dropped. However, this had a major impact on the relative value of tax-exempt bonds, as their after-tax yield stayed the same, while taxable securities improved at the new 21% rate (Figure 1).
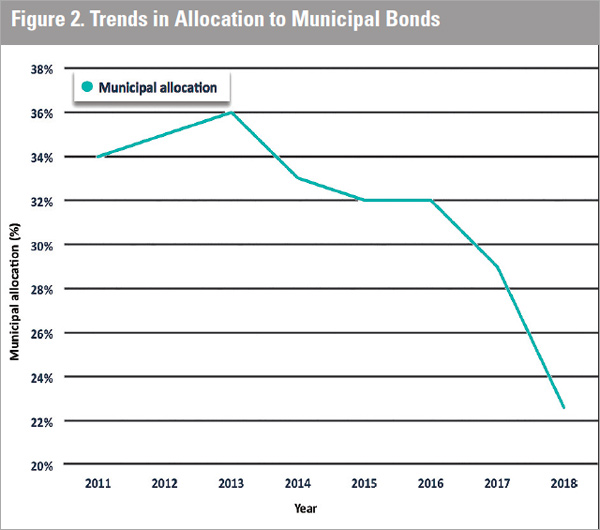
Because of the decrease in the corporate tax rate, there are now many opportunities in a P/C insurer’s portfolio to sell tax-exempt municipals and reinvest into higher-yielding taxable securities, depending on the book yield of the bonds and their investment horizon. This was the major theme for the insurance industry in 2018 and continued into the first half of 2019 (Figure 2).
Opportunistic swaps have driven the overall allocation of tax-exempt municipals down 6%, year over year, while book yields have seen an increase of approximately 0.17%. When examining this trend, it seems rational to ask why there hasn’t been a greater reduction in tax-exempt municipal allocations, since they are now less attractive for P/C insurers in the current market environment. The answer is that many of these securities were purchased during periods of higher interest rates, and, therefore, have relatively high book yields. While the after-tax yields for these bonds may have fallen in the wake of tax reform, they are still higher than what can be achieved today, given prevailing interest rates. Insurers are, therefore, unwilling to sell these higher yielding bonds, which would also incur capital gains taxes, and are instead opting to hold these bonds to maturity. As the bonds mature, we anticipate further reductions in tax-exempt municipal allocations, as cash is redeployed into taxable subsectors.
In 2018, the insurance industry focused reinvestment into U.S. corporate debt and residential mortgage-backed securities (RMBS), comprising approximately two-thirds of purchases. However, tax-exempt municipals comprised only 10% of securities purchased, rep- resenting over one-third of all sales. We anticipate further reduction in this space, as maturities and opportunistic swaps present themselves.
While many of these trades present opportunities for increasing yield and income, it is important that P/C companies manage the incremental risk associated with these swaps. For instance, on the front end of the yield curve (one to three years), insurance companies can often sell tax-exempt municipals and reinvest the proceeds in AAA-rated asset-backed securities, thereby increasing portfolio yield. However, longer-term securities (five to 10 years) often require that the proceeds from the sale be reinvested in U.S. corporate debt.
As of July 31, 2019, the Barclays Tax- exempt Index was rated AA/AA-, while the Barclays U.S. Corporate Index (which now comprises more than 50% BBB NAIC 2-rated securities) had an average rating of A-/BBB+, approximately four notches lower. Therefore, as P/C insurers swap municipal exposure for corporate exposure, they are typically taking on increased credit risk in the form of lower ratings. As capital models are revisited in the wake of the 2008 financial crisis, numerous changes are being made to increase the risk charges associated with a portfolio of deteriorating credit quality.
BCAR
One such example is the AM Best’s Capital Adequacy Ratio methodology, a quantitative model that helps gauge balance sheet and financial strength for the insurers rated by AM Best. As one element in a recent update to their model, AM Best moved to a value at risk (VaR) standard, a statistical technique used to measure the amount of risk over a selected time horizon. A higher VaR score indicates more risk and within each rating level, the required capital for each bucket has been updated. In most cases, the capital requirement is much higher than was derived using
previous model iterations. For example, the capital charge for a 10-year A-rated security rose from 0.40% to 2.7% and the capital charge for a 10-year BBB-rated security increased from 1.3% to 5.9%!
As we enter the late stages of a credit cycle, it is important that insurance companies also consider their risk tolerances on a holistic basis. Stochastic stress testing and scenario modeling can help management understand the full scope of the potential downside risk within a portfolio and how it may expose the parent company to potential operational losses. An increased corporate debt allocation can further exacerbate potential losses in the event of a credit downturn. So, these opportunistic swaps are not free money but rather a calculated risk P/C insurers can opt to take.
Having a clearly defined risk tolerance, understanding risk/reward implications, and placing internal controls on portfolio allocations can help management be prepared in the aftermath of a credit event, while still identifying ways to increase portfolio yield in this low- yield environment.